Important Information:
Investing involves risk, including the loss of principal.
An investor should consider the investment objectives, risks, charges, and expenses of the Fund carefully before investing. To obtain a prospectus containing this and other information, please call 1-888-393-KURV (5878). Read the prospectus carefully before investing by clicking here.
Past performance is no guarantee of future results. The performance data quoted here represents past performance. Current performance may be lower or higher than the performance data quoted above. Investment return and principal value will fluctuate, so that shares, when redeemed, may be worth more or less than their original cost.
Short term performance, in particular, is not a good indication of the fund’s future performance, and an investment should not be made solely on returns. The ETFs shown are not meant to be a representative sample of all equity income ETFs or tech ETFs. For standardized performance current to the most recent month end for KQQQ, please call (833) 955-5878 or go to KQQQ Fund page of this site.
All funds shown are managed differently and do not react the same to economic or market events. The investment objectives, strategies, policies or restrictions of other funds may differ, and more information can be found in their respective prospectuses. Therefore, we generally do not believe it is possible to make direct fund comparisons in an effort to highlight the benefits of a fund versus another. More information regarding the differences in these ETFs investment strategies shown on the later page.
Source: US Bank, Morningstar 2025.
This presentation is solely for informational purposes and does not intend to make an offer or solicitation for the sale or purchase of any specific securities, investments, or investment strategies. These materials are made available on an “as is” basis, without representation or warranty. The information contained in these materials has been obtained from sources that Kurv Investment Management LLC. believes to be reliable, but accuracy and completeness are not guaranteed. This information is only current as of the date indicated and may be superseded by subsequent market events or for other reasons. Neither the author nor Kurv Investment Management LLC. undertakes to advise you of any changes in the views expressed herein.
Comparing the KQQQ ETF with the other funds is useful for investors seeking to understand the different approaches to gaining exposure to the technology sector and the Nasdaq-100 index. While funds like QQQ and QTEC are passive, index-tracking ETFs, and VGT focuses on the broader information technology sector, KQQQ is an actively managed ETF that utilizes a momentum-based weighting strategy and covered call options for potential downside mitigation and income generation. Unlike the other covered call funds (QQQI, IQQQ, JEPQ, and JEPI), which generally write covered calls on their entire portfolio, KQQQ uses a dynamic strategy, selectively writing calls on stocks with limited upside or low price momentum.
The ETFs shown are not meant to be a representative sample of all equity income ETFs. All funds shown are managed differently and do not react the same to economic or market events. The investment objectives, strategies, policies or restrictions of other funds may differ, and more information can be found in their respective prospectuses. Therefore, we generally do not believe it is possible to make direct fund comparisons in an effort to highlight the benefits of a fund versus another.
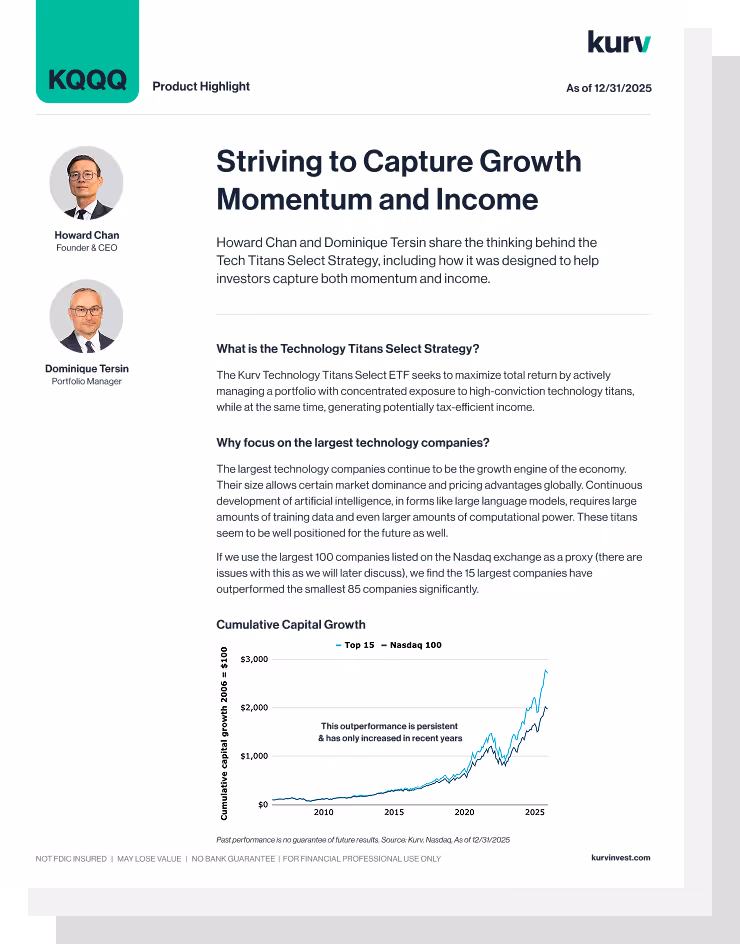
Fund Objective: The Fund seeks to maximize total return by actively managing a portfolio with concentrated exposure to high-conviction technology titans while, at the same time, generating potentially tax-efficient income.
An investment in the Fund entails risk, including the loss of principal. The Fund is not a complete investment program, and investors should review the risks associated with the Fund before investing. The Fund is an actively managed portfolio, and the portfolio managers will apply investment techniques and risk analyses that may not produce the desired result. There can be no guarantee that the Fund will meet its investment objective.
As an ETF, the Fund is exposed to the additional risks, including: (1) concentration risk associated with Authorized Participants, market makers, and liquidity providers. Such concentration could negatively impact liquidity; (2) costs and risks associated with frequent trading; (3) market prices may differ from the Fund’s net asset value; and (4) liquidity risk due to a potential lack of trading volume.
Fund Risks: The Fund will invest in the equity securities of, or derivative instruments (e.g., options) relating to, Technology Companies. Accordingly, the performance of the Fund could be negatively impacted by events affecting this sector. Market or economic factors impacting technology companies and companies that rely heavily on technological advances could have a significant effect on the value of the Fund’s investments. The value of equity securities, such as common stocks and preferred securities, may decline due to general market conditions that are not specifically related to a particular company or to factors affecting a particular industry or industries. Equity securities generally have greater price volatility than fixed-income securities. When the Fund or an Underlying Kurv ETF invests in fixed income securities or fixed income ETFs, the value of your investment in the Fund will fluctuate with changes in interest rates. Typically, a rise in interest rates causes a decline in the value of fixed-income securities. The Fund may engage in certain transactions, such as options, that may give rise to leverage, magnifying gains and losses, and causing the Fund to be more volatile than if it had not been leveraged. This means that leverage entails a heightened risk of loss. Because the Fund is “non-diversified,”it may invest a greater percentage of its assets in the securities of a single issuer or a smaller number of issuers than if it were a diversified fund. As a result, a decline in the value of an investment in a single issuer or a smaller number of issuers could cause the Fund’s overall value to decline to a greater degree than if the Fund held a more diversified portfolio.
Synthetic Long Risks: The Fund will also invest in the Kurv Yield Premium ETFs. The Fund may gain long exposure via purchasing shares of individual companies or creating a synthetic long position. To achieve a synthetic long exposure, the Fund buys call options of a technology company and, simultaneously, sells put options of the same company to try to replicate the price movements of the underlying company. The combination of the long call options and sold put options seek to provide the Fund with investment exposure to the underlying company for the duration of the application option exposure. Please note that the synthetic long and underlying equity security may not attain a 1:1 correlation. The notional exposure to an underlying company when the Fund buys put and call options directly will not exceed 150% of net asset value (when obtaining exposure to an underlying company through an Underlying Kurv Yield Premium ETF, notional exposure will be limited to 100% of net asset value). The call options the Fund buys and the put options it sells will be at the same strike price and have the same expiration, however, the amount may differ.
Underlying Kurv Yield Premium ETF Risks: The Fund will invest in Underlying Kurv ETFs, so the Fund’s investment performance is likely to be related to the performance of the Underlying Kurv ETFs. An investment in the Fund entails more costs and expenses than the combined costs and expenses of direct investments in the Underlying Kurv ETFs. Each Underlying Kurv ETF invests in options contracts which are based on the value of its Underlying Security and subjects each ETF to the risks associated with the industry of the corresponding Underlying Issuer. Each Underlying Kurv ETF employs a strategy of selling call option contracts, limiting its participation in the value increase of the Underlying Security during the call period. Should an Underlying Security’s value increase beyond the sold call options’ strike price, the Underlying Kurv ETF may not experience the same extent of increase, potentially underperforming the Underlying Security and experiencing a NAV decrease, especially given its full exposure to any value decrease of the Underlying Security over the call period. The Underlying Kurv ETFs aim to provide monthly income, although distributions are not guaranteed, and amounts may vary. Monthly distributions may consist of capital returns, reducing each ETFs NAV and trading price over time which could lead to significant losses for investors (including the Fund). Repetitive payment of distributions may erode the Underlying Kurv ETFs NAV and trading price over time, which could result in notable losses for the Fund. The continuous application of each Underlying Kurv ETFs call writing strategy impacts its ability to participate in the positive price returns of its Underlying Security, which in turn affects each Underlying Kurv ETF’s returns both during the term of the sold call options and over longer time frames. Some securities held by the Underlying Kurv ETFs, including options contracts, may be difficult to sell or be illiquid, particularly during times of market turmoil. This risk is greater for the Underlying Kurv ETFs as each will hold options contracts on a single security, and not a broader range of options contracts.
Distributor: Foreside Fund Services, LLC. Foreside Fund Services, LLC and Kurv Investment Management LLC are unaffiliated.
Volatility is a statistical measurement of the degree of variability of the return of a security or market index. "Return divided by volatility" is a widely used metric for calculating risk-adjusted return to compare return for volatility risk taken.
Distribution Rate is the annual yield an investor would receive if the most recently declared distribution, which includes option premium, remained the same going forward. The Distribution Rate is calculated by multiplying an ETF’s Distribution per Share by 365 divided by the days in the most current month, and dividing the resulting amount by the ETF’s most recent NAV. The Distribution Rate represents a single distribution from the ETF and does not represent its total return. Distributions are not guaranteed.
30-day SEC Yield is based on a formula mandated by the Securities and Exchange Commission (SEC) that calculates a fund's hypothetical annualized income, as a percentage of its assets. A security's income, for the purposes of this calculation, is based on the current market yield to maturity (in the case of bonds) or projected dividend yield (for stocks) of the fund's holdings over a trailing 30-day period. This hypothetical income will differ (at times, significantly) from the fund's actual experience; as a result, income distributions from the fund may be higher or lower than implied by the SEC yield.
Unsubsidized 30-Day SEC Yield represents what a fund's 30-Day SEC Yield would have been had no fee waiver or expense reimbursement been in place over the period.
The Distribution Rate and 30-day SEC Yield is not indicative of future distributions, if any, on the ETFs. In particular, future distributions on any ETF may differ significantly from its Distribution Rate or 30-Day SEC Yield. You are not guaranteed a distribution under the ETFs. Distributions for the ETFs (if any) are variable and may vary significantly from month to month and may be zero. Accordingly, the Distribution Rate and 30-Day SEC Yield will change over time, and such change may be significant. The distribution may include a combination of ordinary dividends, capital gain, and return of investor capital, which may decrease a fund’s NAV and trading price over time. As a result, an investor may suffer significant losses to their investment. These distribution rates caused by unusually favorable market conditions may not be sustainable. Such conditions may not continue to exist and there should be no expectation that this performance may be repeated in the future.