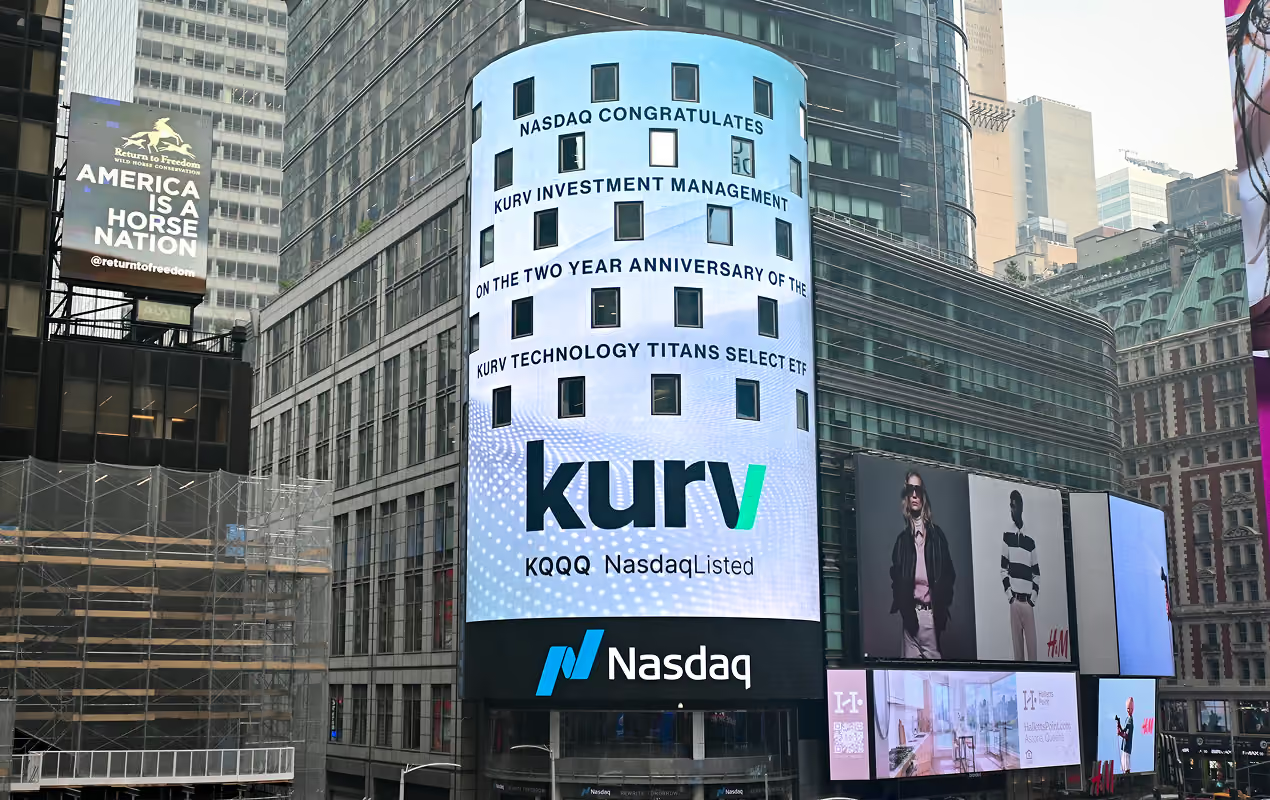
There is no shortage of ETFs these days. But there is a shortage of ETFs that handily outperform their peers. And as it celebrates its second anniversary, the Kurv Technology Titans Select ETF (KQQQ) stands out as one of those rare funds that has not only enjoyed solid performance–it’s handily outshone its direct competitors.
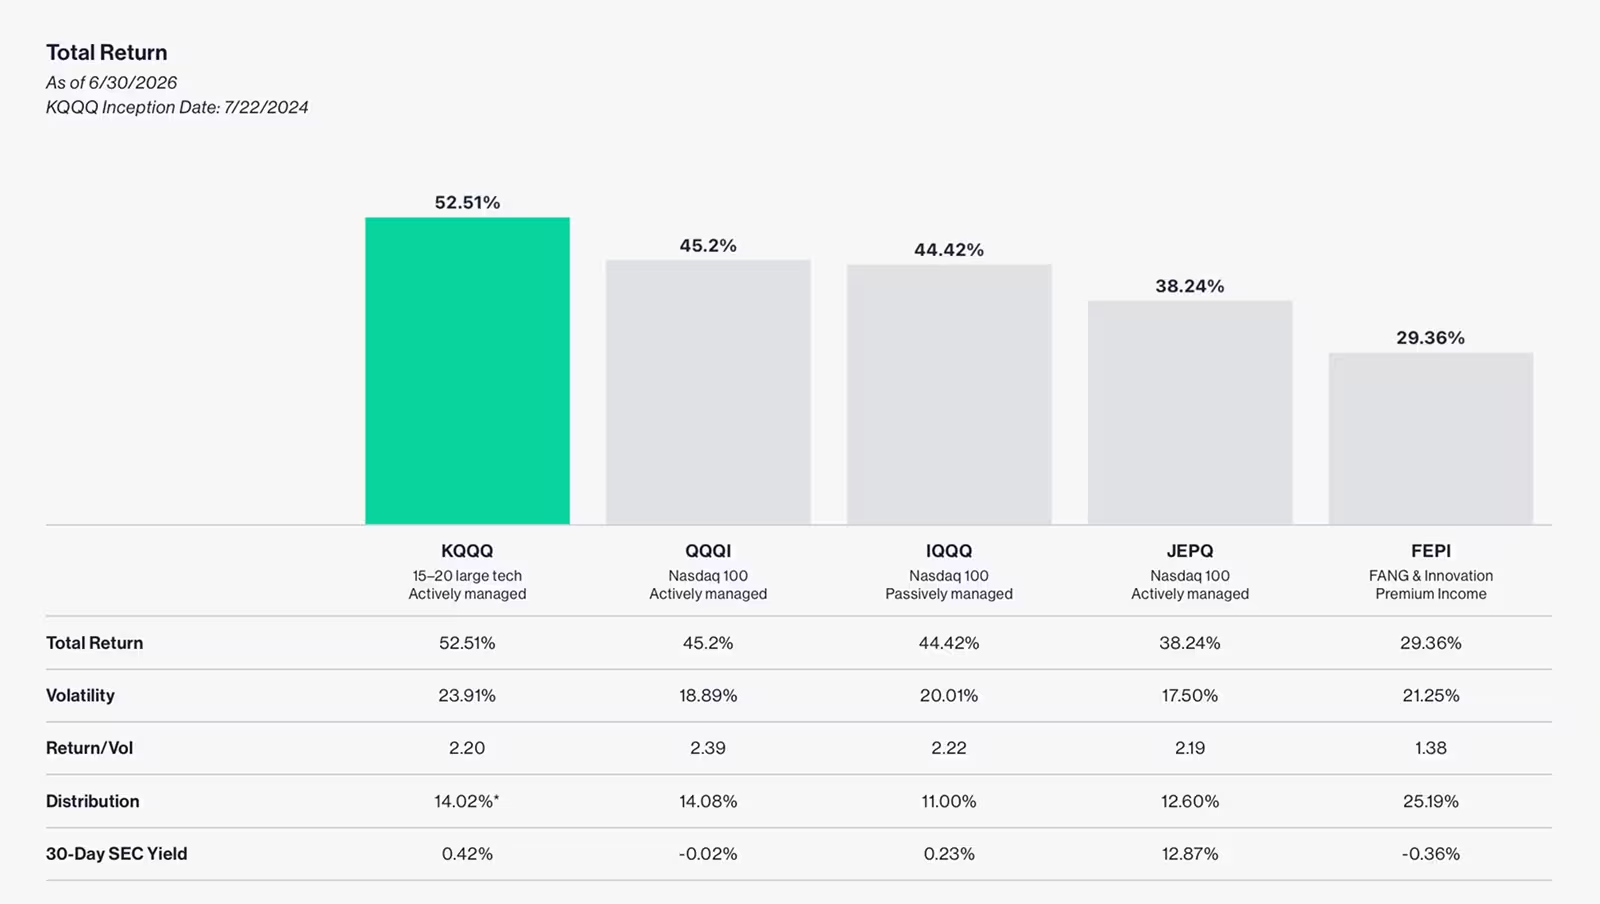
As the following chart shows, since inception KQQQ has delivered a 52.51% return (based on MKT price), significantly outpacing other actively managed, option-income technology ETFs.
A Thesis Confirmed: Explaining KQQQ’s Stellar Run
When Kurv launched KQQQ, we did so after developing a rigorous, data-driven thesis. As we laid out in a product spotlight last year, our belief was that a concentrated portfolio of high-conviction technology titans with stock price momentum would outperform broad technology indexes like the Nasdaq 100.
We observed that based on historical data, a portfolio of the largest 15 names in the index had significantly outperformed the smaller 85 stocks (partly because many of the latter equities are not actually tech companies and do not enjoy the same growth or earnings power). From a risk perspective, our work showed a curious quality of the largest 15 tech companies: They performed in line with the broader market on the downside but outperformed on the upside. In other words, investors were not taking on more risk to get better returns (based on history, at least)
Our thesis behind KQQQ also revolved around momentum. In short, we argued that large cap tech names with price momentum usually kept going up until they reached a pivot point. Until such a point was reached, it made sense to own (and perhaps be overweight these stocks). But when momentum rolled over, that was the time to underweight a stock and even increase call writing strategies to earn an option premium.
We’ve managed the strategy with the above in mind. First, KQQQ has benefitted from security selection: We went overweight semiconductors as they showed momentum and that turned out to be the right move. Meanwhile, we’ve also harvested compelling option premiums along the way on tech stocks where momentum has faded and implied volatilities were attractive.
Income was indeed a key factor behind KQQQ’s approach. In this regard, our belief was that many investors sacrifice growth because they need monthly cash flow from their holdings. So, someone might own slow-growth utilities or banks simply because those stocks sport decent yields. With tech stocks, dividend yields tend to be paltry because the companies are reinvesting free cash flow to keep growing.
We addressed the growth-income dilemma by utilizing option strategies that generated consistent cash flow. And one year in, KQQQ has not just provided growth for our investors, it’s also delivered compelling income as well. The income, it should be noted, has not come at the expense of NAV, as NAV continues to grow.
Looking Ahead
Past performance, as they say, is no guarantee of future results. So, we cannot promise that KQQQ’s future years will look like its first two. But what we can confidently say is that the fund’s outperformance in its first two years in operation is not fluke—but rather the result of a detailed thesis that has since been confirmed. Here’s to many more successful anniversaries.
Short term performance, in particular, is not a good indication of the fund’s future performance, and an investment should not be made solely on returns. The ETFs shown are not meant to be a representative sample of all equity income ETFs or tech ETFs. For standardized performance current to the most recent month end for KQQQ, please call (833) 955-5878 or go to KQQQ Fund page of this site. Source: US Bank, Morningstar 2025.
This presentation is solely for informational purposes and does not intend to make an offer or solicitation for the sale or purchase of any specific securities, investments, or investment strategies. These materials are made available on an “as is” basis, without representation or warranty. The information contained in these materials has been obtained from sources that Kurv Investment Management LLC. believes to be reliable, but accuracy and completeness are not guaranteed. This information is only current as of the date indicated and may be superseded by subsequent market events or for other reasons. Neither the author nor Kurv Investment Management LLC. undertakes to advise you of any changes in the views expressed herein.
Comparing the Kurv Technology Titans Select ETF with the other funds is useful for investors seeking to understand the different approaches to gaining exposure to the technology sector and the Nasdaq-100 index. While funds like QQQ and QTEC are passive, index-tracking ETFs, and VGT focuses on the broader information technology sector, KQQQ is an actively managed ETF that utilizes a momentum-based weighting strategy and covered call options for potential downside mitigation and income generation. Unlike the other covered call funds (QQQI, IQQQ, JEPQ, and JEPI), which generally write covered calls on their entire portfolio, KQQQ uses a dynamic strategy, selectively writing calls on stocks with limited upside or low price momentum.
The products shown are not meant to be a representative sample of all equity income ETFs. All funds shown are managed differently and do not react the same to economic or market events. The investment objectives, strategies, policies or restrictions of other funds may differ, and more information can be found in their respective prospectuses. Therefore, we generally do not believe it is possible to make direct fund comparisons in an effort to highlight the benefits of a fund versus another. More information regarding the differences in these ETFs investment strategies shown on the later page.
NEOS Nasdaq-100® High Income ETF (QQQI)
NEOS Nasdaq-100® High Income ETF (QQQI) seeks to distribute high monthly income generated from investing in the constituents of the Nasdaq-100® Index and implementing a data-driven call option strategy.
For the Fund's standardized performance: Click here.
For the Fund's prospectus: Click here.
Expense Ratio: 0.68%, 30-Day SEC Yield: -0.02%
ProShares Nasdaq-100 High Income ETF (IQQQ)
ProShares Nasdaq-100 High Income ETF (IQQQ) seeks to provide high income and long-term growth through a strategy that combines a long position in the Nasdaq-100 Index with a daily covered call writing strategy.
For the Fund's standardized performance: Click here.
For the Fund's prospectus: Click here.
Expense Ratio: 0.55%, 30-Day SEC Yield: 0.23%.
JP Morgan Nasdaq Equity Premium Income ETF (JEPQ)
JP Morgan Nasdaq Equity Premium Income ETF (JEPQ) seeks to deliver monthly distributable income and Nasdaq 100 exposure with less volatility.
For the Fund's standardized performance: Click here.
For the Fund's prospectus: Click here.
Expense Ratio: 0.35%, 30-Day SEC Yield: 12.87%
REX FANG & Innovation Equity Premium Income ETF (FEPI)
REX FANG & Innovation Equity Premium Income ETF (FEPI) is an actively managed exchange-traded fund (“ETF”) that seeks current income while maintaining the opportunity for exposure to the share price (i.e., the price returns) of the securities of the companies comprising the Solactive FANG Innovation Index (the “Index”).
For the Fund's standardized performance: Click here.
For the Fund's prospectus: Click here.
Expense Ratio: 0.65%, 30-Day SEC Yield: -0.36%.
Kurv Technology Titans Select ETF
Fund Risks: The Fund will invest in the equity securities of, or derivative instruments (e.g., options) relating to, Technology Companies. Accordingly, the performance of the Fund could be negatively impacted by events affecting this sector. Market or economic factors impacting technology companies and companies that rely heavily on technological advances could have a significant effect on the value of the Fund’s investments. The value of equity securities, such as common stocks and preferred securities, may decline due to general market conditions that are not specifically related to a particular company or to factors affecting a particular industry or industries. Equity securities generally have greater price volatility than fixed-income securities. When the Fund or an Underlying Kurv ETF invests in fixed income securities or fixed income ETFs, the value of your investment in the Fund will fluctuate with changes in interest rates. Typically, a rise in interest rates causes a decline in the value of fixed-income securities. The Fund may engage in certain transactions, such as options, that may give rise to leverage, magnifying gains and losses, and causing the Fund to be more volatile than if it had not been leveraged. This means that leverage entails a heightened risk of loss. Because the Fund is “non-diversified,”it may invest a greater percentage of its assets in the securities of a single issuer or a smaller number of issuers than if it were a diversified fund. As a result, a decline in the value of an investment in a single issuer or a smaller number of issuers could cause the Fund’s overall value to decline to a greater degree than if the Fund held a more diversified portfolio.
Free cash flow: Free cash flow (FCF) is the actual cash a company generates after covering its operating expenses and capital expenditures.