
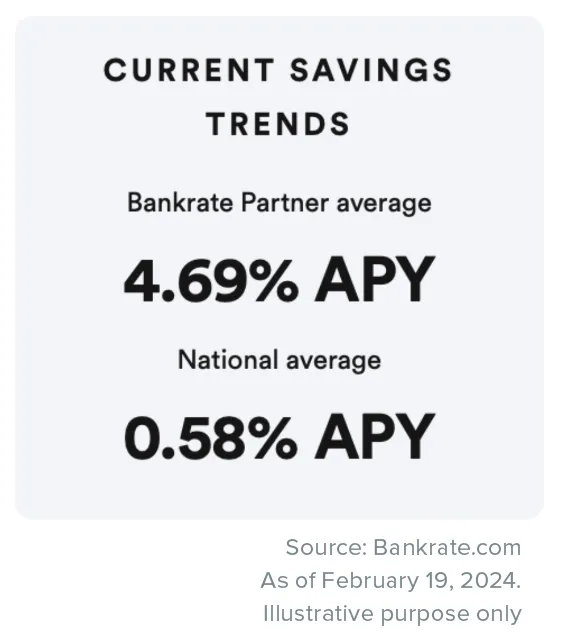
As I write this, Bankrate.com, a popular U.S. website that publishes national surveys of savings accounts and certificates of deposit (CDs), shows that the annual percentage yield of the average U.S. savings account is 0.58%. By comparison, their top savings account partners offer a substantially higher yield of 4.69%.
But if you put your money into a savings account today, even at these top partners, are you guaranteed to get 4.69% interest in a year’s time? The answer is: probably not. The quoted annual percentage yield is the annualized rate that a bank currently pays out, assuming no other actors change in the next year. As most savvy investors know, the only constant in the financial markets is that financial markets and conditions are never constant. Variables continuously shift based on endogenous and exogenous forces.
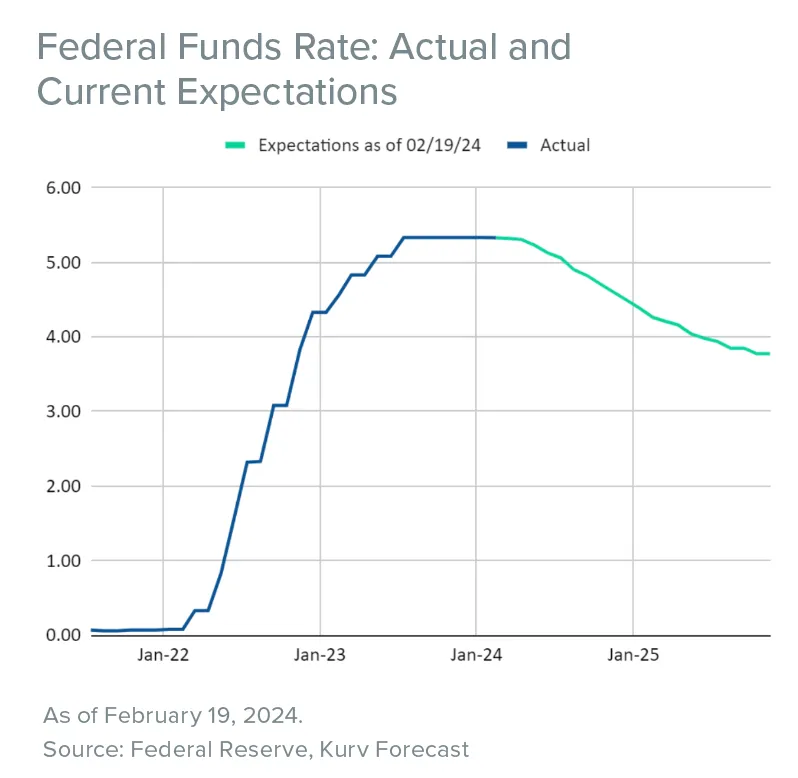
For example, the market currently believes that economic conditions will tighten, resulting in rate cuts from the Fed starting in June. If this market expectation were realized, lower Fed Funds Rate would likely lead to lower savings rates. Savers will likely be unable to achieve the currently quoted 4.69% yield.
So why is this seemingly non-accurate, potentially deceptive annualized yield methodology used for most retail/consumer financial products? Yield annualization provides standardization that allows consumers and professionals to compare a single number across different financial products. A higher yield should imply that an investor is being compensated for a higher level of risk in the product than a product with a lower yield. The measure may be useful for products with low yield volatility and less accurate with higher yield volatility. Again, the standardization is great, but users should not forget that the annualization process assumes that the rate you get now is the rate you will continue to get over the next year, whether true or not.
In Jason Zweig’s The Intelligent Investor, published on February 16, 2024, titled “A Fund With a 94.9% Yield? You Guessed it, There is a Catch”, he warns his readers that the distribution yield from covered call ETFs, though acknowledged to be published in line with required FINRA and SEC regulations, may be misleading from a return perspective.
And you might be surprised to know that we at Kurv AGREE! However, our reasons are more nuanced and detailed.
First, let’s establish facts. Using our Kurv Yield Premium Strategy Tesla (TSLA) ETF (ticker: TSLP) as an example, we declared and distributed $0.5555 per share from the fund (shown in the bottom table on our website: https://www.kurvinvest.com/etf/tslp). This is a realized yield of 2.59%, which is the distribution-per-share divided by the NAV of the fund (0.5555/21.45). We opt to show this number because we believe it is a more accurate representation of what an investor actually received in January.
Income-focused investors who use covered call ETFs are generally focused on the monthly dividend amount they receive. They will ask ETF issuers to publish a distribution yield number so they can compare the yield received from other investments in their portfolio. Per FINRA rules, any published yield numbers must be accompanied by the 30-day SEC yield. The 30-day SEC yield is an annualized number. So, to provide an apples-to-apples (annualized to annualized) comparison, managers must show the annualized version of the distribution yield, which is 30.49% (Formula: (Distribution per share / NAV) * [annualization factor = 365 / (number of days in the month]) or 2.59% * [365 / 31]). As mentioned before, annualizing a yield number implicitly bakes into the assumption that this is the yield you may expect to receive on a forward-looking basis for the next 12 months.
Managers who give the false impression that the distribution yield can remain constant and actively market it that way are doing a disservice to their investors. At Kurv, we don’t do that. We look to distribute, at most, only the premiums that can be harvested from the market, which may change month-to-month as we write the covered calls. Tying a fund to a distribution rate will most likely lead to overdistribution.
As an aside, it is also important to note that the distribution yield and the 30-SEC yield are calculated by an independent third party, our custodian and books of record, U.S. Bank. The same calculation is used for all of their investment management clients.
So what is an investor to do?
At Kurv, we believe our investors should look at two measures without baked-in assumptions.
Monthly distribution-per-share: As mentioned, these are realized distributions and do not have any forward-looking implications. By dividing the distribution by NAV, you get the current realized monthly yield of the investment.
Total Return attribution: A more accurate representation of distribution is via the decomposition of total return. For example, Kurv Yield Premium Strategy Microsoft (MSFT) ETF’s total return (ticker: MSFY) for January is 5.37%, of which 4.39% is price return and the remaining 0.98% is income return. There are no embedded assumptions in these numbers.
Any annualized yield will have baked-in, forward-looking assumptions. This problem will worsen in a higher base-rate environment. For decades, we got used to a zero-interest rate environment. Annualizing a yield number of zero or close to zero will still produce a yield number that is zero or close to zero. The higher the rate environment, annualization will exaggerate the difference in yield in different financial products. So buyers need to be savvy not only in the investments they put their money into but also in the tools or indicators they use to compare their investments.
With the run up in equity markets this year and tightening of high yield spreads, investors should reassess the upside return potential for each stock exposure and high yield bond allocation in their portfolio. If the expected returns are limited from capital appreciation, enhancing income generated from our Yield Premium Strategy ETF could be an attractive engine for additional portfolio returns.
For any questions or comments, please reach out to us at info@kurvinvest.com or visit us at kurvinvest.com.
The views and information discussed here are as of the date of publication, are subject to change, and may not reflect the current views of the firm.The performance data quoted represents past performance and does not guarantee future results. Investment return and principal value of an investment will fluctuate. Current performance may be higher or lower than the performance quoted. High short-term performance may be unusual, and investors should not expect such performance to be repeated. Performance of less than one year is cumulative. For the most recent month-end performance, please call 1-833-955-KURV (5878) or visit kurvinvest.com.THIS MATERIAL MUST BE PRECEDED OR ACCOMPANIED BY A PROSPECTUSAn investor should carefully consider a Fund’s investment objective, risks, charges, and expenses before investing. A Fund’s prospectus and summary prospectus contain this and other information about the Kurv ETFs. To obtain a Fund’s prospectus and summary prospectus call 1-833-955-KURV (5878) or download from kurvinvest.com. A Fund’s prospectus and summary prospectus should be read carefully before investing.Kurv Yield Premium Strategy ETFs Risks – An investment in the Funds involves risks, including the possible loss of principal. In seeking to achieve its investment objective, the Fund implements a “synthetic covered call” strategy using the standardized exchange-traded and/or FLEX options. The Fund’s synthetic covered call strategy consists of the following three elements: Synthetic long exposure to the stated security, which allows the Fund to seek to participate in the changes, up or down, in the price of stock. Covered call writing (where call options are sold against the synthetic long portion of the strategy), which allows the Fund to generate income. Short-dated fixed income instruments, which are used for collateral for the options, and which also generate income.The Funds are non-diversified and include risks associated with the Fund concentrating its investments in a particular security, industry, sector, or geographic region which can result in increased volatility. The Fund’s investments in derivatives such as futures contracts and swaps may pose risks in addition to, and greater than, those associated with directly investing in securities or other investments, including imperfect correlations with underlying investments or the Fund’s other portfolio holdings, higher price volatility, lack of availability. As a result, the value of an investment in the Fund may change quickly and without warning. The Funds are actively managed. Risks of the Funds include Effects of Compounding and Market Volatility Risk, Leverage Risk, Derivatives Risk, Counterparty Risk, Rebalancing Risk, Sector Risk, Investing Risk, Single Security Risk, Market Risk, and risks specific to the security. Please see the summary and full prospectuses for a more complete description of these and other risks of the Funds.Distributor: Foreside Fund Services, LLC.NAV: The dollar value of a single share, based on the value of the underlying assets of the fund minus its liabilities, divided by the number of shares outstanding. Calculated at the end of each business day.Market Price: The current price at which shares are bought and sold. Market returns are based upon the last trade price.30-day SEC Yield is based on a formula mandated by the Securities and Exchange Commission (SEC) that calculates a fund’s hypothetical annualized income, as a percentage of its assets. A security’s income, for the purposes of this calculation, is based on the current market yield to maturity (in the case of bonds) or projected dividend yield (for stocks) of the fund’s holdings over a trailing 30-day period. This hypothetical income will differ (at times, significantly) from the fund’s actual experience; as a result, income distributions from the fund may be higher or lower than implied by the SEC yield.Unsubsidized 30-Day SEC Yield represents what a fund’s 30-Day SEC Yield would have been had no fee waiver or expense reimbursement been in place over the period.