This week marks the one-year anniversary for the Kurv Silver Enhanced Income ETF (KSLV)! We also recently celebrated the same milestone for the Kurv Gold Enhanced Income ETF (KGLD), so we thought it would be a good time to recap the wild time it’s been in metals in the last 12 months, show how these funds have performed, and reiterate our case for precious metals exposure.
Gold and Silver Go Parabolic, Then Re-Set
Everything changed for gold and silver prices in the fall of 2025. Gold started September under $3,500 per ounce but added a very strong 11%1 by the end of the month. Silver did even better, rising 17% to close September at just under $47 per ounce.2 As we’ve noted previously, much of the move in silver was a catch-up to the already strong performance that gold had put in over previous months. Silver is often seen as the “poor man’s gold”, so investors flock to it when the gold to silver ratio gets historically high (it touched 101 in May of last year).3 Think of it as a metals value play.
Pullbacks in the fall were brief and quickly bought by investors. From September 2025 through February 2026, physical gold ETF holdings rose from 3,838 tonnes to 4,171 tonnes4—an increase of about 333 tonnes, or 8.7%. While silver demand from investors was also robust during this period, we also saw very strong fundamental demand. Lease rates, a measure of market tightness, soared at one point to 30%.5
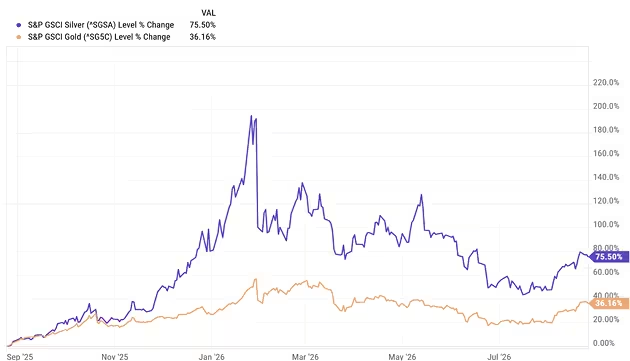
Both gold and silver went parabolic from December to late January, with gold reaching $5,600 and silver hitting around $121. On virtually every technical analysis tool (such as the Relative Strength Index), the metals had become incredibly overbought. We then entered a period of consolidation which lasted until early summer.
The Metals are Back
Gold languished above $4,000 before springing to life in August. Today it trades around $4,640, in part propelled by the Treasury’s decision to double the size of its long-term debt buybacks in an effort to lower long-term yields. Silver, meanwhile, has surged from $58 to $68.50 in this timeframe. By targeting lower long-term yields, the Treasury’s action reduces the opportunity cost of owning physical gold and silver.
Zooming Out: The Case for Gold and Silver is Intact
When we launched KGLD and KSLV, we did so with a straightforward thesis. Like many investors, we’re concerned about the enormous debts of the U.S., Japan, and other large developed market nations. Over time, it’s reasonable to expect these countries to inflate away the real burden of these obligations in something of a stealth default.
We believe exposure to hard assets is an antidote to such debasement. And it’s not just private investors who seem to be acting to protect themselves: Many central banks have also been adding considerable amounts of gold to their own reserves in a bid to diversify away from paper currencies.
Silver has an added bullish twist: The market is estimated to be in an annual deficit of nearly 100 million ounces due to strong industrial demand. So even without investor buying, there seems to be solid price support.
KGLD and KSLV: Strong Performers + Income for Investors
KGLD and KSLV are not designed to be like physically backed precious metals ETFs. Indeed, in bringing these funds to market, we recognized that many potential gold and silver investors stay away because metals do not typically offer cash flow along the way. That’s why both ETFs maintain synthetic exposure to metal prices via options and use options to generate ongoing income. Episodes of heightened volatility can be especially attractive for this strategy as that’s when implied volatilities in options tend to be higher.
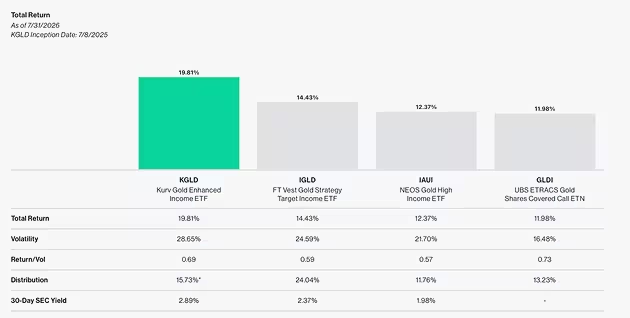
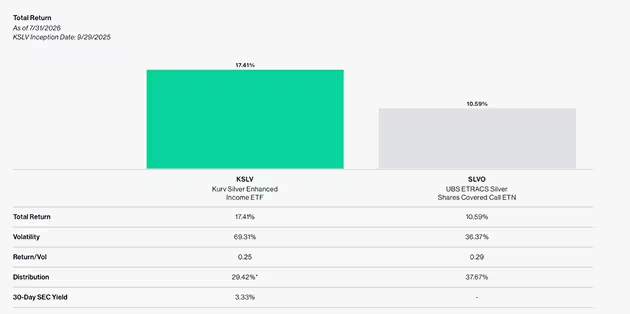
As the following chart shows, roughly one year in, both KGLD and KSLV are more than holding their own against competitor ETFs. And they’ve put in this performance while also delivering substantial distributions to investors.
Precious Times are Here Again
Given recent flows, debasement worries may be coming back into focus as the US Treasury attempts to manage yields on long-dated Treasury bonds.
As fear about U.S. government debt spreads, we would not at all be surprised if these current gold and silver runs have legs. And for investors seeking income alongside their precious metal exposure, KGLD and KSLV may just be the answers.
1 World Gold Council
2 Statmuse
3 Bullion World
4 World Gold Council
5 Mining.com
Glossary:
Parabolic: In finance, parabolic describes a sudden, extreme, and accelerating vertical price increase in an asset that resembles the right side of a mathematical parabola curve on a chart.
Relative Strength Index is a popular momentum indicator used in technical analysis to measure the speed and magnitude of recent price changes.
Short term performance, in particular, is not a good indication of the fund’s future performance, and an investment should not be made solely on returns. The ETFs shown are not meant to be a representative sample of all equity income ETFs or tech ETFs. For standardized performance current to the most recent month end for KSLV and KGLD, please call (833) 955-5878 or go to KSLV Fund page and KGLD Fund Page of this site. Source: US Bank, Morningstar 2025.
This presentation is solely for informational purposes and does not intend to make an offer or solicitation for the sale or purchase of any specific securities, investments, or investment strategies. These materials are made available on an “as is” basis, without representation or warranty. The information contained in these materials has been obtained from sources that Kurv Investment Management LLC. believes to be reliable, but accuracy and completeness are not guaranteed. This information is only current as of the date indicated and may be superseded by subsequent market events or for other reasons. Neither the author nor Kurv Investment Management LLC. undertakes to advise you of any changes in the views expressed herein.
Comparing the KGLD ETF or KSLV ETF with the other funds is useful for investors seeking to understand the different approaches to gaining exposure to the precious metals sector.
The products shown are not meant to be a representative sample of all equity income ETFs. All funds shown are managed differently and do not react the same to economic or market events. The investment objectives, strategies, policies or restrictions of other funds may differ, and more information can be found in their respective prospectuses. Therefore, we generally do not believe it is possible to make direct fund comparisons in an effort to highlight the benefits of a fund versus another. More information regarding the differences in these ETFs investment strategies shown on the later page.
FT Vest Gold Strategy Target Income ETF (IGLD)
The investment objective of the FT Vest Gold Strategy Target Income ETF® (the "Fund") is to seek to deliver participation in the price returns of the SPDR Gold Trust (the "Underlying ETF") while providing a consistent level of income. The Fund will invest substantially all of its assets in U.S. Treasury securities and in the shares of a wholly-owned subsidiary that holds exchange-traded options, including FLexible Exchange Options ("FLEX Options"), that reference the performance of the Underlying ETF.
For the Fund's standardized performance: Click here. For the Fund's prospectus: Click here. Expense Ratio: 0.85%, 30-Day SEC Yield: 2.37%
NEOS Gold High Income ETF (IAUI)
The NEOS Gold High Income ETF (the “Fund”) seeks to generate high monthly income with the potential for appreciation based on exposure to exchange-traded products (“ETPs”) that have direct exposure to gold.
For the Fund's standardized performance: Click here. For the Fund's prospectus: Click here. Expense Ratio: 0.78%, 30-Day SEC Yield: 1.98%
ETRACS Gold Shares Covered Call ETN (GLDI)
The ETRACS Gold Shares Covered Call ETNs (such exchange traded notes, the "ETNs") are senior, unsecured debt securities issued by UBS AG, acting through its London Branch, that are linked to the return of the NASDAQ Gold FLOWS™ 103 Index (the "Index"). The ETNs may pay a monthly variable cash coupon based on the notional option premiums received from selling call options. The ETNs are listed on the NASDAQ Stock Market under the ticker symbol "GLDI". The ETNs should be purchased only by knowledgeable investors who understand the risks of investing in the ETNs.
To view the fund's standardized performance: Click here. To view the fund's prospectus: Click here. Expense Ratio: 0.65%.
ETRACS Silver Shares Covered Call ETN (SLVO)
The ETRACS X-Links™ Silver Shares Covered Call ETNs (such exchange traded notes, the "ETNs") are senior, unsecured debt securities issued by UBS AG, acting through its London Branch, that provide a return linked to the performance of the price return version of the NASDAQ Silver FLOWS™ 106 Index (the "Index"). The ETNs may pay a monthly variable cash coupon based on the notional option premiums received from selling call options. The ETNs are listed on the NASDAQ Stock Market under the ticker symbol "SLVO". The ETNs should be purchased only by knowledgeable investors who understand the risks of investing in the ETNs.
For the Fund's standardized performance Click here. For the Fund's prospectus: Click here. Expense Ratio: 0.65%.
Kurv Gold Enhanced Income ETF
Fund Risks: The Fund may invest in gold and gold bullion-related Exchange traded Funds ("ETFs"), Exchange Traded Products ("ETPs"), and derivatives. The price of gold may be volatile and gold bullion-related ETFs, ETPs, and derivatives may be highly sensitive to the price of gold. The price of gold bullion can be significantly affected by international monetary and political developments such as currency devaluation or revaluation, central bank movements, economic and social conditions within a country, transactional or trade imbalances, or trade or currency restrictions between countries. Physical gold bullion has sales commission, storage, insurance and auditing expenses.
Kurv Silver Enhanced Income ETF
Fund Risks: The fund may invest in silver and silver bullion-related Exchange traded Funds ("ETFs"), Exchange Traded Products ("ETPs"), and derivatives. The price of silver may be volatile and silver bullion-related ETFs, ETPs, and derivatives may be highly sensitive to the price of silver. The price of silver bullion can be significantly affected by international monetary and political developments such as currency devaluation or revaluation, central bank movements, economic and social conditions within a country, transactional or trade imbalances, or trade or currency restrictions between countries. Physical silver bullion has sales commission, storage, insurance and auditing expenses.